)

Our research into the changes in Earth’s global temperature has informed every major international assessment of climate change.
Work on compiling a global temperature record began at the Climatic Research Unit (CRU) at UEA in the 1980s. Previously led by Prof Phil Jones, and more recently by Prof Tim Osborn, over time it’s provided crucial evidence for climate change, fought climate sceptics and effected positive change.
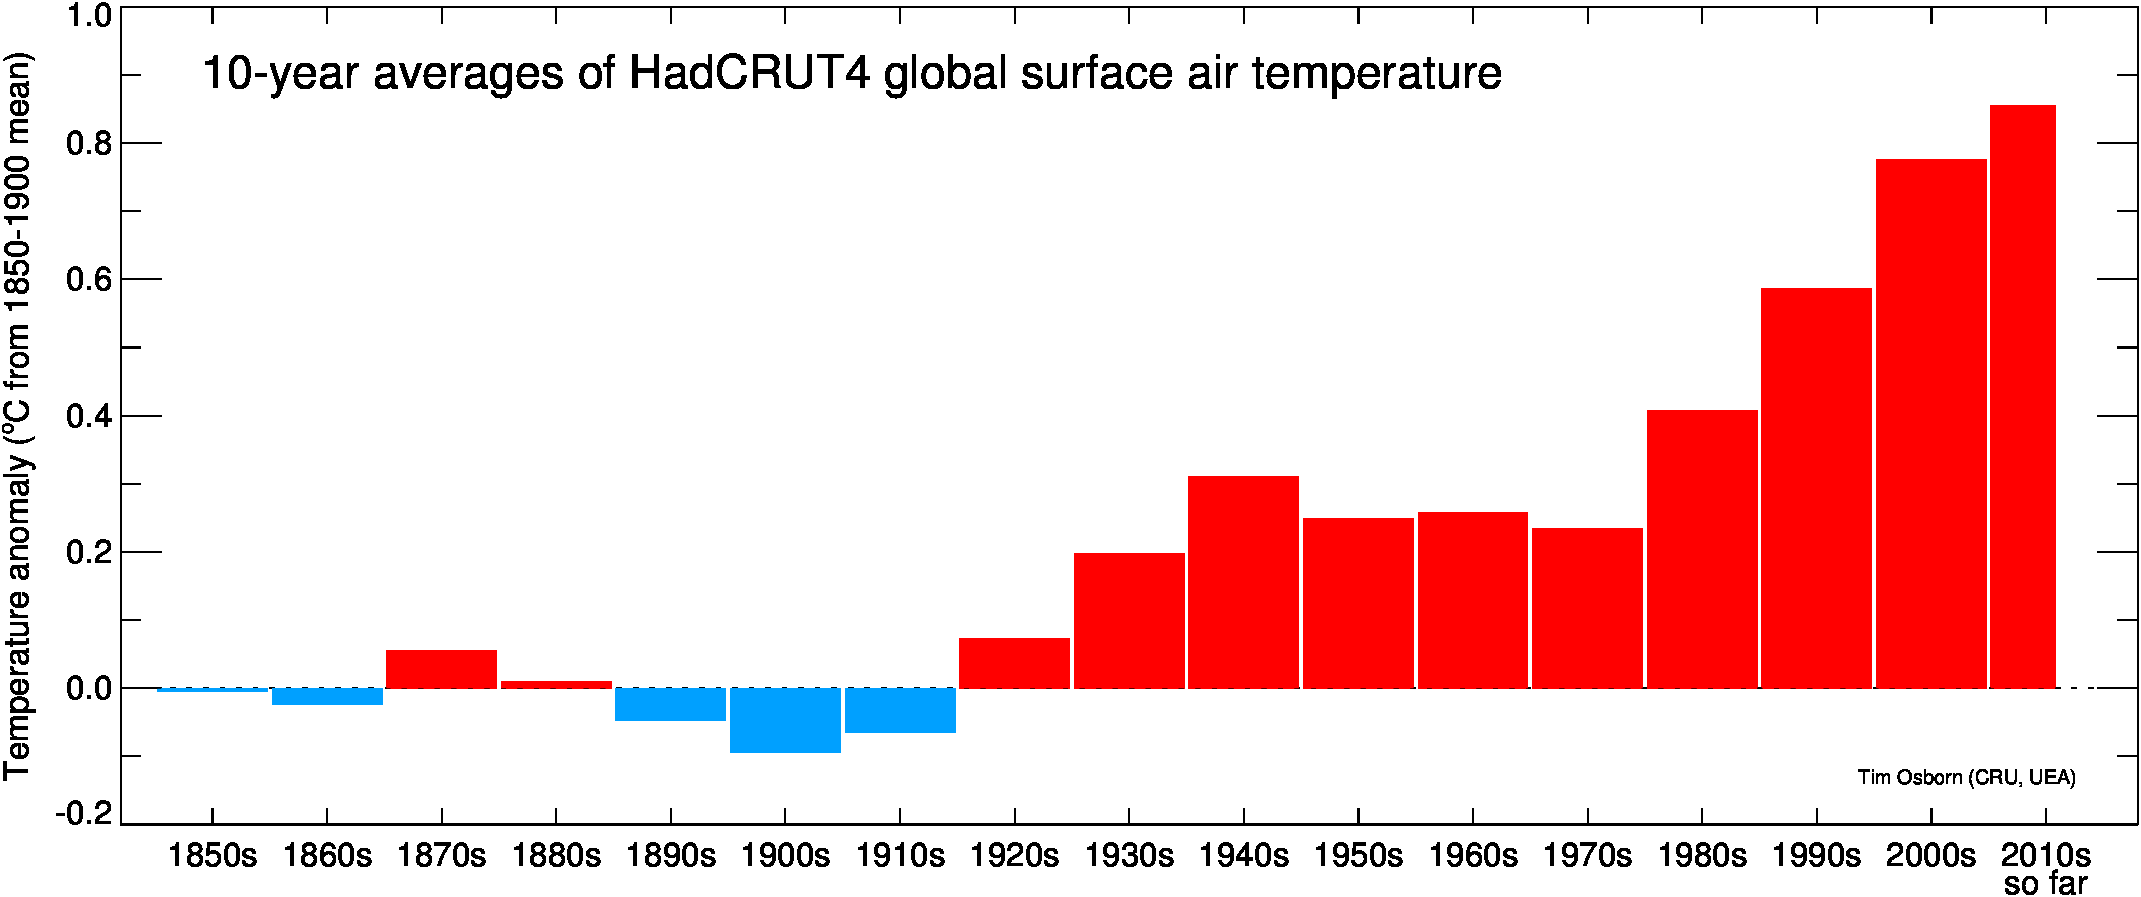
CRU’s land air temperature dataset, combined with sea surface temperature data from the Met Office, is known as HadCRUT. This global temperature set is one of just three used to monitor global warming since 1850 by international organisations, including the World Meteorological Organisation and the United Nations (UN).
Defining the pre-industrial baseline
Estimating global temperature from raw data not explicitly designed for climate monitoring purposes is a significant challenge. But it’s a challenge UEA researchers have risen to over the past few decades – and HadCRUT is central to their success.
Policymakers often express global temperature changes relative to a ‘pre-industrial baseline’. In the past they did not, however, define this baseline. And so working with the University of Reading and others, researchers at CRU made a thorough assessment of the warming since the pre-industrial baseline to provide a better estimate of where we stand in 2022.
HadCRUT spans from 1850 to today, taking us closer to the pre-industrial baseline considered key by policymakers. Our ongoing research shows that the 2011-20 decade was 1.1±0.1 °C warmer than pre-industrial levels.

Together with Earth’s surface temperature, changes in other fundamental meteorological variables such as precipitation, vapour pressure and cloud cover have also been determined by research at CRU. Tracking these changes has led to the creation of a complementary dataset known as CRU TS, which reveals regional climate changes for multiple variables over land and collects data for monitoring droughts.
Today, CRU TS is one of the most widely used and respected datasets in climate science, and it’s received long-term funding from the UK’s National Centre for Atmospheric Science to sustain it.
‘We estimate that the underlying warming of global average temperature has now reached around 1.2°C above pre-industrial levels, an increase almost entirely due to human activities – principally the release of carbon dioxide into the atmosphere by burning coal, oil and gas.’ – Prof Tim Osborn, UEA
A historic moment, informed by our science
The 2015 Paris Agreement is a legally binding international treaty on climate change, adopted at COP21 in the French capital under the UN Framework Convention on Climate Change (UNFCCC). The UNFCCC is a science-based convention and relies on the Intergovernmental Panel on Climate Change (IPCC) to provide the baseline state of knowledge on climate change and it’s through a series of critical IPCC reports that our research highlighting the scale and rate of climate change influenced the treaty.
In fact, the HadCRUT global temperature record has appeared in the Summary for Policy Makers and Synthesis Report of all six IPCC assessments from 1990 through to the latest in 2021.
The mutually agreed goal of the Paris Agreement was to limit global warming to well-below 2°C and to actively aim to keep it to 1.5°C. These are essential targets if we are to significantly reduce the risks and impacts of climate change and to achieve the goals defined in terms of global-mean temperature changes relative to a pre-industrial baseline – the very baseline our research has helped define.
‘UEA’s research led to important improvements in this record, especially in the better quantification of its uncertainties and biases, enabling a more robust IPCC assessment of climate change warming.’ – Co-chair, IPCC Working Group
Informing the UK’s net zero commitments
Long before delegates arrived in Glasgow for COP26, the UK government had committed to reduce greenhouse gas emissions by at least 80% by 2050 from 1990 levels. The Climate Change Act of 2008 is legally binding and has formed a basis for renewed efforts to tackle climate change at a government policy level.
UK government policy on international action for climate change from 2010 to 2015 stated that the earth’s surface has ‘warmed by about 0.8°C since around 1900, with much of this warming occurring in the past 50 years’. The scientific evidence for this statement comes from our HadCRUT temperature record.
When, in 2019, the Climate Change Act was strengthened to mandate net-zero carbon emissions by 2050, the Committee on Climate Change’s report began with a presentation of the climate science that was evidenced by our global temperature record. And again, the ‘pre-industrial levels’ quoted in this report were based on our contribution to the IPCC report.
Taking centre stage
Not just restricted to policy documents, CRU’s global temperature record also took centre stage at the opening ceremony of the 2016 Summer Olympics in Rio, putting UEA’s climate research firmly in the global conversation around climate change. The Olympic ceremony featured an animated spiral detailing the rise in temperatures from 1850 to the present, and it was based on UEA’s own HadCRUT dataset.
Over 300 million people worldwide watched this global spectacle, a significant achievement and a huge global audience for the vital research CRU has been doing for decades.
Related content / sources
A timeline of UEA’s climate research, ClimateUEA
Our climate research, action, stories, Climate of Change
The story behind Climategate drama The Trick, UEA stories