With the help of land owner / manager members of the Wensum Alliance, a number of high-spec monitoring installations were put in place to collect data.  In 2013, the research began with experiments across nine fields, to test measures that aimed to reduce diffuse pollution. Further down this page you can take a look at the baseline data that has been collected. 

State-of-the-art monitoring equipment was used for long-term measurements to both identify and record pollutants and to evaluate the effectiveness of measures to reduce it. The study considered the impacts and effects on ecosystems and sustainable production and aimed to improve understanding of how to predict and control diffuse pollution from agriculture.

The monitoring programme design uses the “before-after, control-impact” (BACI) comparison approach. It features automatic water sampler and monitoring stations in both a ‘control’ mini-catchment and in a similar mini-catchment where measures to reduce diffuse pollution will be introduced. Impacts of the measures on groundwater will be evaluated from borehole monitoring.

Diagram outlining experiment set up


A whole range of measurements were taken to record changes in surface water and groundwater quality. The Wensum Alliance helped identify monitoring needs and locations for monitoring equipment. Key features of the monitoring programme are shown below:

Surface Water monitoring

At three spatial scales:

  • Wider catchment (existing monitoring sites)
  • Sub-catchment scale (<10 km2) (investigation of source-transport pathways)
  • Mini-catchment scale (<1 km2) (investigation of mitigation measures)

Dual-instrumentation approach using:

  • Sensor web-based monitoring technology
  • Autoanalysers + conventional autosamplers + multi-parameter sonde + weather station + stream flow gauging

Key measurements:

  • DO, temp, EC, pH, Cl, redox potential
  • Turbidity, suspended solids concentration
  • Chlorophyll
  • Total P, PO4
  • Total N, NO3, NO2, NH4
  • Faecal indicator organisms, BOD, DOC

Biological Monitoring:

  • Annual/seasonal monitoring using standardised equipment in accordance with monitoring protocols
  • Expansion of current Catchment Sensitive Farming monitoring (invertebrates, fish, diatoms, macrophytes)
  • Ecological status expressed using Biological Monitoring Working Party (BMWP) biotic scoring method for bottom-dwelling (benthic) invertebrates
  • BOD data, biotic scores and abundance of aquatic insects to assess biological status and the impact of oxygen depletion caused by diffuse pollution inputs
  • Replicate biotic scores from manipulated and control catchments with analysis by ANOVA or equivalent non-parametric tests for non-normally distributed data

Groundwater monitoring:

  • Paired shallow (Quaternary deposits) and deep (Chalk) boreholes for groundwater level and quality monitoring in the manipulated mini-catchments to monitor catchment responses to recharge events.
  • New borehole installations to core the unsaturated zone to provide solute profiles.

The plot (below left) shows total phosphorus (TP) concentration data collected in the Wensum DTC at Kiosk E in the Blackwater sub-catchment. The high-resolution, 30-minute sampling at the bankside monitoring station reveals that TP concentrations exceeded the environmental water quality standard for 22% of the time during 2011 and 2012. In comparison, weekly water sampling at the same location did not capture the high concentration values seen during storm events, so sampling by this method results in an apparent exceedance of the standard for only 12% of the time.

The plot (below right) shows the same type of graphical representation for nitrate concentration (as N). The weekly grab sample data show that the water quality standard is only exceeded once during the period April 2011- December 2012 while the high-resolution data from the bankside monitoring station indicate that high concentrations were experienced for 9% of the period.

Graphs showing N & P exceedance curves

This illustrates the extra understanding gained from our high-intensity state-of-the-art monitoring equipment. This type of evidence generated by the DTC monitoring programme supports the idea that a concentration frequency target may be more meaningful ecologically than average concentrations or loads given that it relates directly to the duration of exposure of aquatic organisms to nitrogen, phosphorus and sediment. 

A further illustration of the insights provided by this detailed monitoring is shown in the image below which records the outputs obtained following a heavy rainfall event after a period of dry weather in 2012.

Graphs showing impacts of a heavy rainfall event


Monitoring in the Blackwater Study Area:

The map below shows the Blackwater area of the Wensum catchment and the approximate locations of the monitoring sites. The area has been divided into a number of zones. Two of these (C & D) act as 'controls' where no intervention took place. Two other areas (A & B) are where our farmer/landowner colleagues participated in experimental changes in crop management with the aim of improving water quality.

Data collected for each monitoring point includes rainfall, flow rates, nitrate and phosphate concentrations etc. If you click on the links below you will be able to see monthly graphs of some of the data from each point.
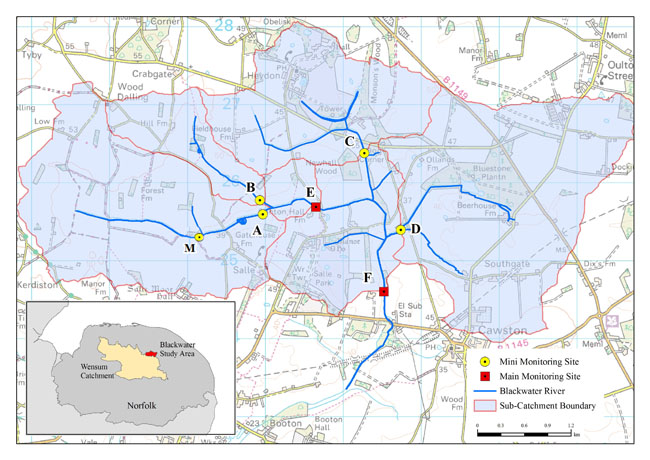
Map of the Blackwater catchment area

Mini-monitoring sites

Mini-monitoring stations are recorded water quality from smaller land areas that in combination with experimental changes in land management helped to identify which factors or combinations of factors lead to improvements in water quality. The kiosks contained an automatic water sampler and multi-parameter sonde, and in-stream turbidity meter, flow meter and water level pressure transducer.

Records the main area where experimental changes in land management  to improve water quality took place.

Point A Monthly data for Rainfall, Water Level & Turbidity 

Point A Monthly data for  Water Temp, pH, Conductivity & Dissolved Oxygen

Records a second area where experimentalchanges in land management  took place.

Point B Monthly data for Rainfall, Water Level & Turbidity 

Point B Monthly data for  Water Temp, pH, Conductivity & Dissolved Oxygen

Records a control area where no changes in landmanagement took place. 

Point C Monthly data for Rainfall, Water Level & Turbidity 

Point C Monthly data for  Water Temp, pH, Conductivity & Dissolved Oxygen​​​​​

Records a second control area where no changes in land management took place.

Point D Monthly data for Rainfall, Water Level & Turbidity 

Point D Monthly data for  Water Temp, pH, Conductivity & Dissolved Oxygen​​​​​​

Records an area upstream of point A where further changes in land management took place.

Point M Monthly data for Rainfall, Water Level & Turbidity 

Point M Monthly data for  Water Temp, pH, Conductivity & Dissolved Oxygen

Main Monitoring sites

The two larger monitoring sites collected a wider range of data. Site E reflects the overall effects of the experimental measures implemented in zones A and B, and site F reflects data from the whole sub-catchment. The Kiosks at E and F contain the same equipment as the Mini-kiosks and additionally include nutrient analysers (Total P, Dissolved reactive P and Nitrate).

At the confluence of subcatchments A & B. Examined the influence of experimental test measures on water quality.

Point M Monthly data for Rainfall, Water Level, Nitrate, Turbidity & Phosphorous

Point M Monthly data for Water Temp, pH, Conductivity & Dissolved Oxygen 

Represents the status of the whole Black-water study area.

Point F Monthly data for Rainfall, Water Level, Nitrate, Turbidity & Phosphorous

Point F Monthly data for Water Temp, pH, Conductivity & Dissolved Oxygen