Dr Valerie Livina Senior Research Associate - School of Environmental Science
Small changes in the climate may have serious consequences for our planet. I am studying whether we can predict them or not.
The benefits of using Grace for High Performance Computing
I did all computational work and stored my data in the cluster during my years at UEA. First, because the computational facilities are excellent, much faster than an average desktop. Second, because the HPC team maintained all software and was always very quick with support and advice (no headache of struggling with installations etc). Third, because it provided reliable backup. Fourth, because it could be accessed remotely wherever I travelled. Perfect solution for computational needs of any researcher, in my opinion.
My work
My research focuses on studying bifurcations and transitions in the climate system using novel methods of statistical analysis: modified degenerate fingerprinting and potential analysis. The approach employs (i) derivation of potential from time series; (ii) study of possible bifurcations of the potential; (iii) projection of the time series according to the estimated transition. The objectives are to examine whether any components of the climate system have already passed a bifurcation point under anthropogenic forcing, and to explore which components may pass a bifurcation point this century.
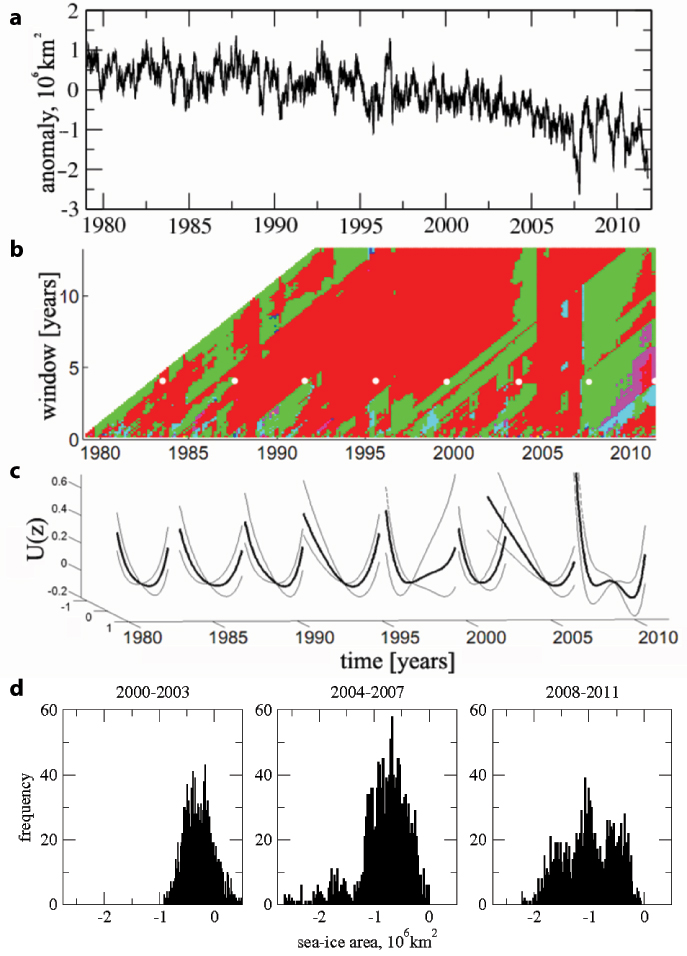
While working at UEA, I developed the potential contour plot technique, which is a novel method of time series analysis and is represented by those characteristic colour figures. My postdoctoral research at UEA was funded by NERC and AXA Research Fund.

Fig 1. Analysis of Arctic sea-ice area.
(a) Sea-ice area anomaly,daily data with mean seasonal cycle removed.
(b) Contour plot of number of detected states, where red = 1 detected state, green = 2, cyan = 3, magenta = 4. Results plotted as a function of sliding window length at the end of the window.
(c) Reconstructed potential curves of eight 4-yr time intervals, corresponding to the white dots
in (b). Here z is sea-ice area fluctuation on a shifted scale. Faint lines are potential curves derived from error estimates on the coefficients of the polynomial potential function (for details see Livina
et al., 2011). In the penultimate interval 2004–2007, a second state starts to appear and in the final interval 2008–2011 there are two states of comparable stability.
(d) Histograms of the data for 2000–2003, 2004–2007, and 2008–2011 from which the corresponding potential curves are derived.
References
Livina V. and T. Lenton, A recent tipping point in the Arctic sea-ice cover: abrupt and persistent increase in the seasonal cycle since 2007, The Cryosphere 7, 275-286 (2013), doi:10.5194/tc-7-275-2013.
Livina V., P. Ditlevsen, and T. Lenton, An independent test of methods of detecting system states and bifurcations in time-series data, Physica A, 391 (3), 485-496 (2011), doi: 10.1016/j.physa.2011.08.025
Livina V., F. Kwasniok, G. Lohmann, J. W. Kantelhardt, and T. M. Lenton, Changing climate states and stability: from Pliocene to present, Climate Dynamics, 37 (11-12), 2437-2453 (2011), doi: 10.1007/s00382-010-0980-2
Livina V., F. Kwasniok, and T. Lenton, Potential analysis reveals changing number of climate states during the last 60 kyr, Climate of the Past 6, 77-82 (2010), doi: 10.5193/cp-6-77-2010
Livina V. and T. Lenton, A modified method for detecting incipient bifurcations in a dynamical system, Geophys. Res. Lett. 34, L03712 (2007), doi: 10.1029/2006GL028672

)