

 |
||||||
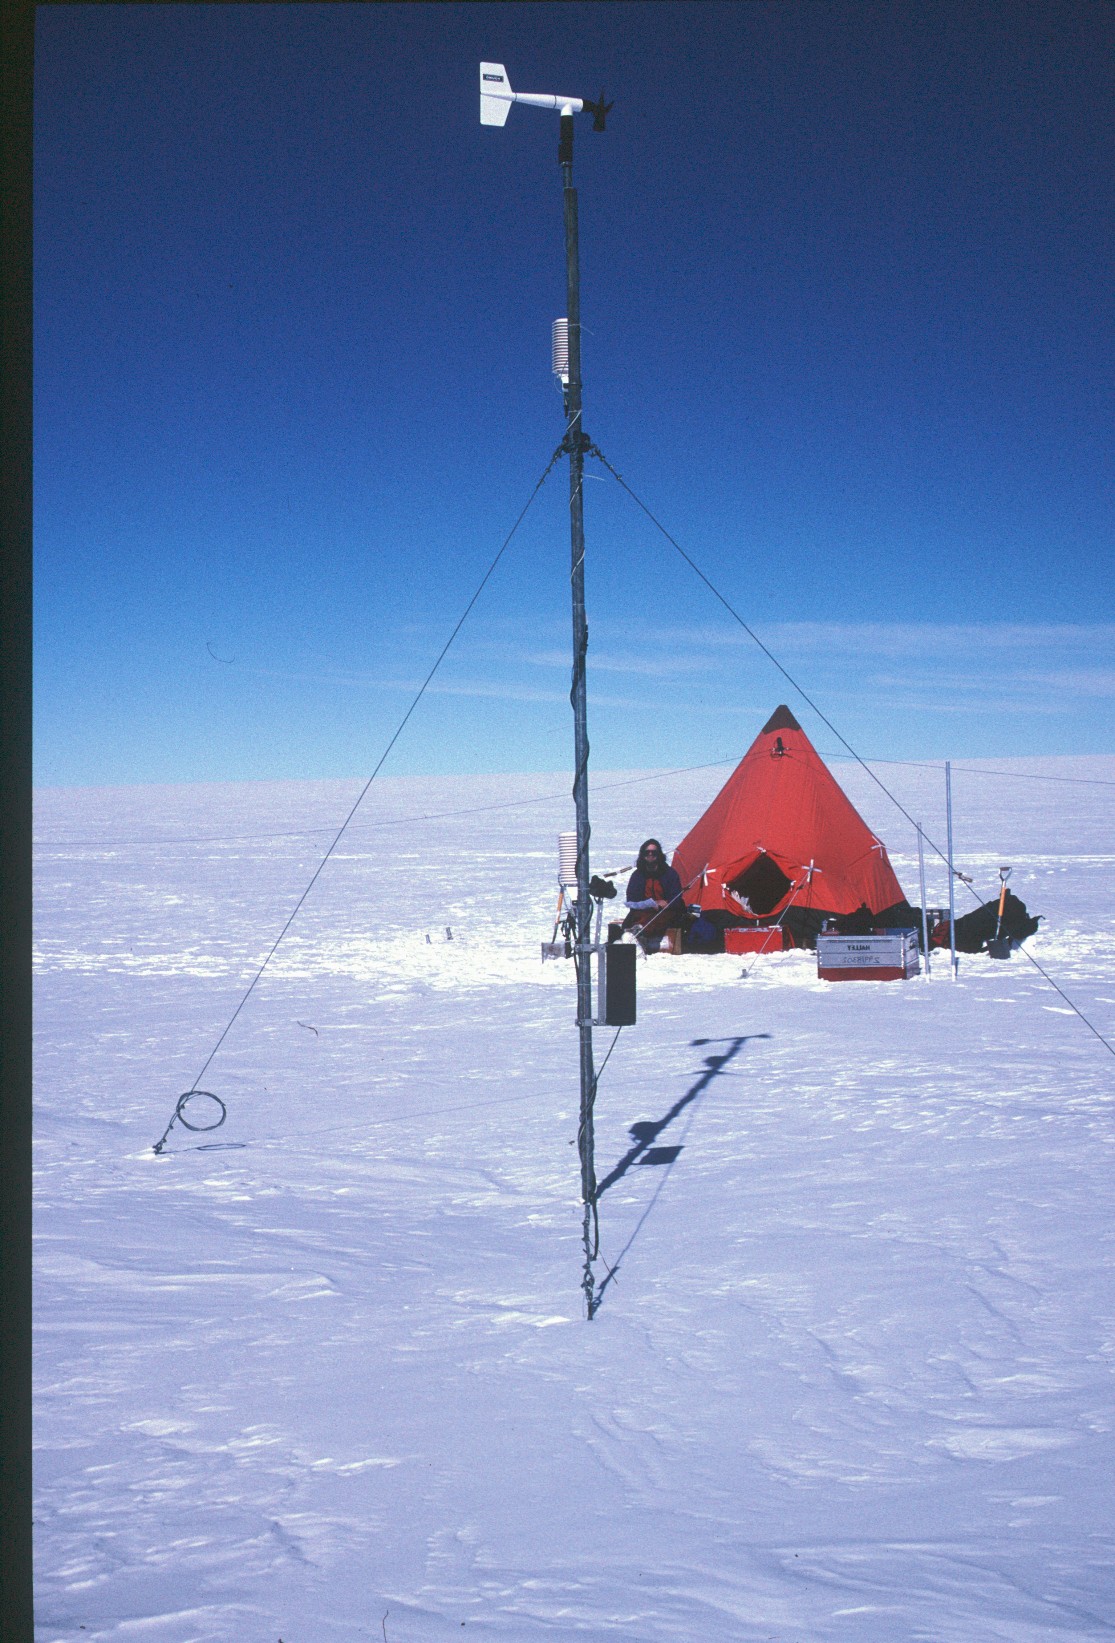
Coats Land AWS Data
REFERENCES & NOTES Full details can be found in: Renfrew, I. A. and P. S. Anderson, 2002: The surface climatology of an ordinary katabatic wind regime in Coats Land, Antarctica, Tellus, 54A, 463-484. However some notes on calibration etc, extracted directly from the paper have been reproduced in the file: STATION METADATA The AWS station details are: location variable = [ 1 2 3 4 5]; |
 |
ASCII DATA
The AWS + Halley data are stored as time series for each month and year
here in file format clamp_yyyy_mm.asc (e.g. clamp_1996_01.asc
is the first file)
The data are in ascii format with each column a variable. The variables
are:
yyyy month day hour minute seconds location ...
windspeed winddirection pressure battery_voltage ...
t1 q1 rh1 rhi1 theta1 ...
t0 q0 rh0 rhi0 theta0 ...
dthetadz rho tau shfx lhfx ...
ppert cloud
The variable names are self explanatory. All variables are quality-controlled and calibrated as described in Renfrew and Anderson (2002). Note 1 indicates the upper sensor and 0 the lower sensor. See Renfrew and Anderson(2002) for a description of how the surface turbulent fluxes and the perturbation pressure are calculated. Note the cloud variable is only filled in at Halley. The location variable (1 to 5) represents the location: 1 = C1, 2 = C2, 3 = C3, 4 = C4, 5 = Halley
MATLAB DATA
I have done much of the data processing and visualisation in Matlab.
If you like you can download the entire 8-year data set (in two files)
from the links below. The first file clamp_aws.mat contains 1996 to 2000,
the second file clamp_pico.mat contains 2001 to 2003.
There is some simple code to read and plot time series linked below. There is much more code and if you're really keen contact me and I can probably let you have a copy, although I can't attest to the programming quality!